NHS A&E winter-pressure forecasting
- Domain
- Urgent and emergency care planning, England
- Decision
- Winter demand ranges one to six months ahead, for planners who set escalation capacity. A bed-escalation layer converts admissions into breach probabilities and ships labelled illustrative, because its validation failed a registered tolerance
- Data
- NHS England monthly A&E attendances and emergency admissions, every provider, Open Government Licence v3. Every published version of every file since 2015, archived under the date it became current: 720 file versions, 121 dates, a panel of 1,072,039 rows
- Methods
- Seasonal naive, ETS and STL+ARIMA baselines; LightGBM per horizon with pooled split-conformal calibration; hierarchical Bayesian model in PyMC; MinT reconciliation over provider, ICB, region and England; an occupancy decision layer
- Tools
- Python, LightGBM, PyMC, GitHub Actions. 480 test functions; 735 collected
- Status
-
Pre-registration frozen as
prereg-v1on 9 September 2026; sealed window opened once, on 15 September 2026. Live forecast built from the 8 October release, published by 31 October, first scored against an outturn on 12 November 2026 - Repo
-
github.com/ellenmarsh1612/nhs-ae-forecast.
make install && make testruns the suite and prints both headline tables from the shipped results; about 17 minutes from a fresh clone
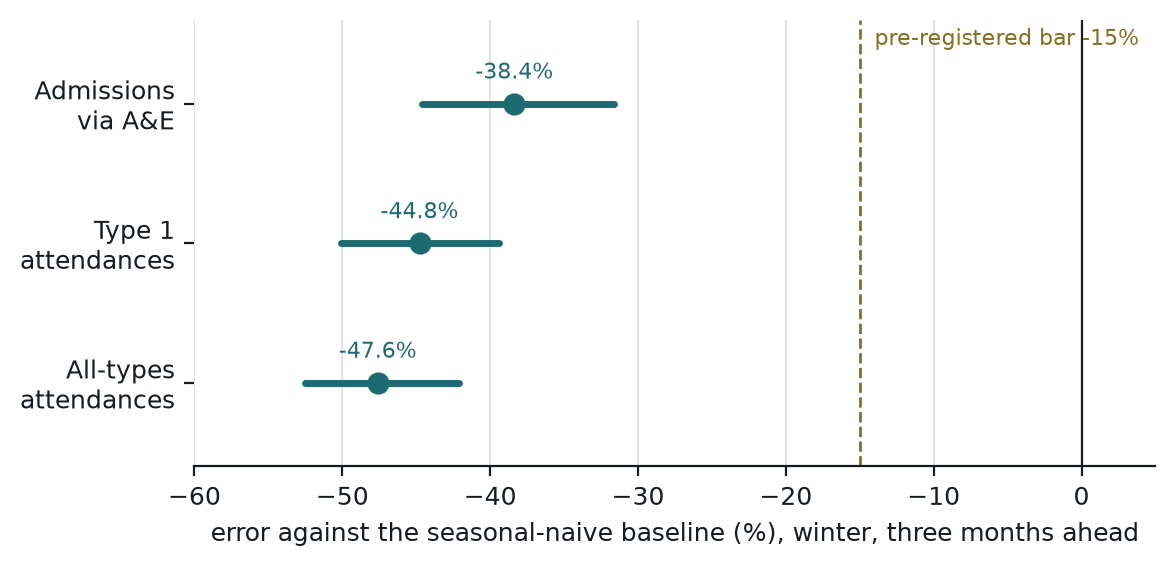
Forecasts of A&E demand for England, calibrated so that a 90% range holds about 90% of the time. On a window sealed before the test, the calibrated forecast covered 87.5–90.3% of outturns at every horizon from one to six months, inside the tolerance fixed in advance; the same forecasts without the calibration layer covered 68–75%. In winter, three months ahead, its error was 38–48% below the seasonal-naive baseline. From 31 October 2026 a live forecast for every integrated care board is published and scored month by month.
Problem and decision
Every autumn, trusts and integrated care boards plan how many escalation beds to open for winter. The plan usually rests on a point forecast, last winter’s figures or judgement, and the costs are asymmetric: too few beds means corridor care and cancelled elective work; too many means staff rostered against beds that stay empty. What the plan needs is a range for each winter month, one to six months ahead, that holds as often as it claims to, so that a board can choose how much risk to carry and know what it has chosen.
This project produces that range for attendances and emergency admissions, measures whether it holds, and publishes it. The backtest runs at provider level, about 194 series a month. The live forecast issues for the 36 integrated care boards, the seven NHS England regions and England, with a trust-level breach table beside it that is labelled illustrative in every row.
Data and its mess
NHS England publishes A&E attendances and emergency admissions for every provider on the second Thursday of each month, under the Open Government Licence, and revises the figures afterwards. Four things had to be handled before any model was fitted.
- Revisions. A backtest on today’s file uses numbers that did not exist at the forecast origin. I recovered every published version of every file since 2015 — 720 file versions across 121 dates, 263 of them from Internet Archive captures of the NHS England year pages, each verified against the server — and stored each under the date it became current. Models are trained on the figures known at each origin (as-of mode) and, separately, on today’s revised figures (final mode); the outturn scored against is always the final figure. Where a month has no surviving as-of version, the origin is excluded or the month dropped from training, and each case is listed in the pre-registration’s appendix.
- Late submissions. Providers miss months and appear in later files. The late-submission and revision components are decomposed separately, and the decomposition was itself a registered hypothesis (H4b below).
- Mergers and reorganisations. 332 provider codes over the history; about 194 provider series score in a given month. The current 36-ICB mapping is applied across the whole history.
- The pandemic. The development window, 69 origins from April 2018 to December 2023, contains the collapse and recovery of 2020–21. The design registered five origin-years as assessable and marked 2020 as not assessable; its coverage is reported under limitations as context.
Three targets are forecast: all-types attendances, Type 1 attendances, and emergency admissions via A&E.
What was tested
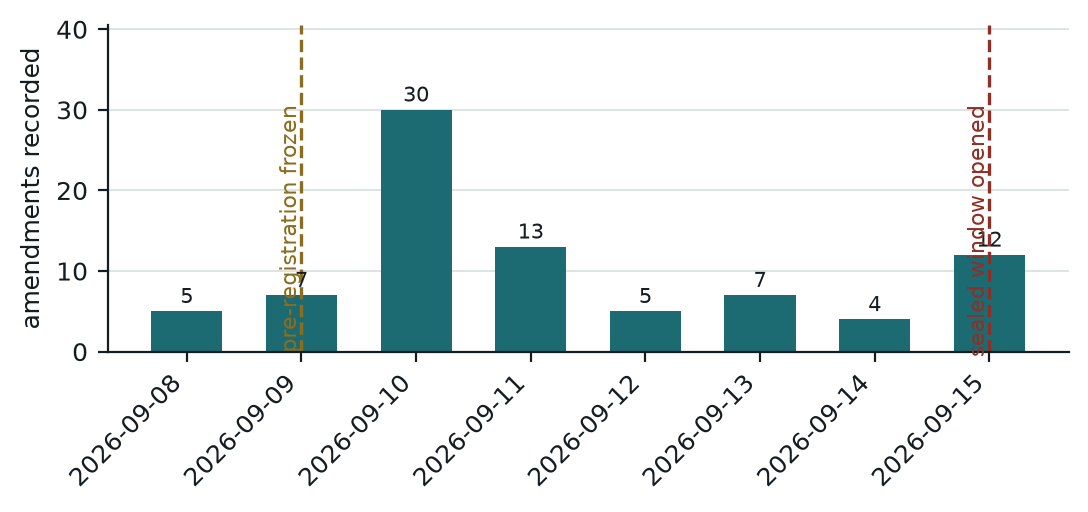
I froze the pre-registration as git tag prereg-v1 on 9 September 2026: the hypotheses with their refutation rules, the model table, the primary comparison and the decision rules. The evaluation window, January 2024 to September 2025, was sealed at that point and opened once, on 15 September 2026, with the opening written to a log. Every change to the plan after the freeze is a dated, reasoned row in the amendment table: 83 rows in all, 71 after the freeze, 32 of them touching a hypothesis.
What “sealed” means here, in the project’s own words: the window was sealed going forward, not unseen. The baselines and the machine-learning model had been scored on those months during development, so for them the confirmatory run is a re-test. The calibration layer and the hierarchical Bayesian model met those months for the first time. The live forecast from October 2026 is the only test no model has seen.
| Registered claim | What it said | Verdict |
|---|---|---|
| Primary comparison | The calibrated forecast’s 90% intervals cover between 85% and 95% of outturns at every horizon | Within tolerance |
| H1 | The machine-learning model’s winter error three months ahead is at least 15% below seasonal naive on all three targets, with the 95% interval entirely beyond the bar | Confirmed |
| H2, M1 clause | The default model’s own conformal intervals under-cover | Confirmed |
| H2, M2 clause | The hierarchical Bayesian model’s posterior intervals hold the 85–95% band | Refuted: 97–99%, too wide |
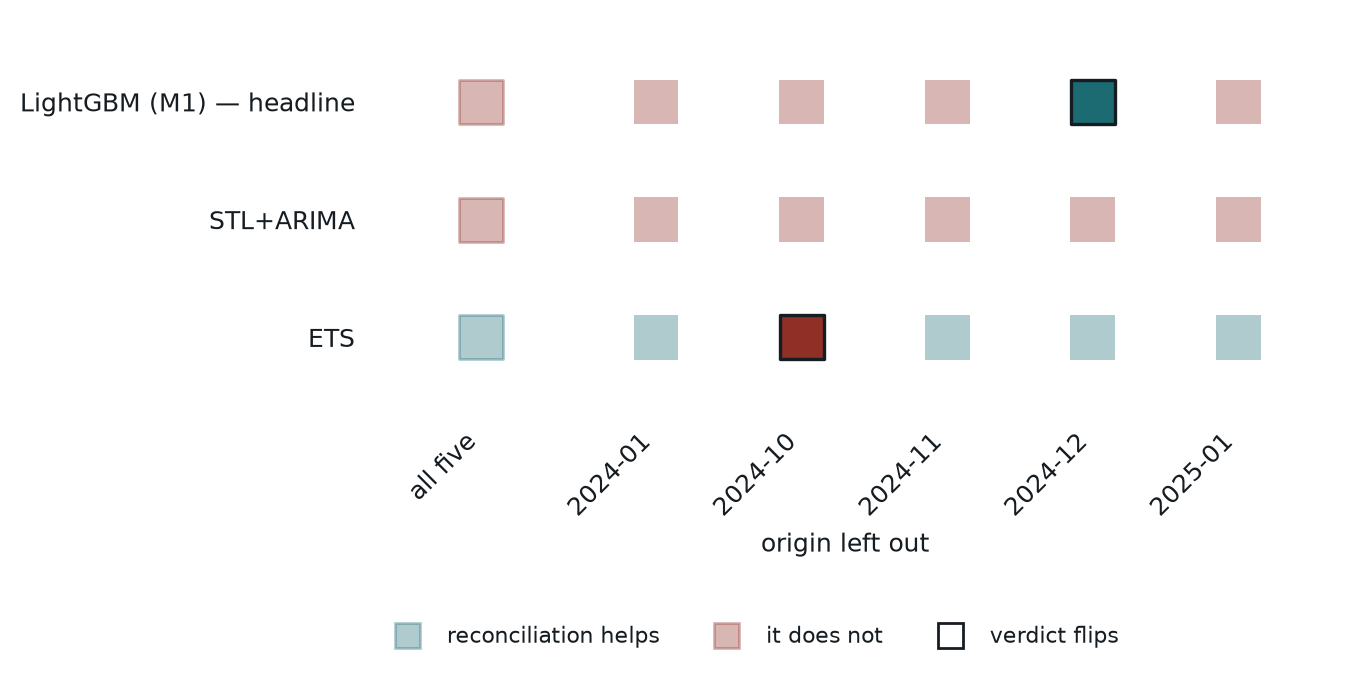
| H3 | Reconciling forecasts up the hierarchy improves ICB accuracy without costing providers more than 2% | Fails for the headline model, and is fragile |
| H4 | Training on revised rather than as-published data changes winter accuracy by less than 2% for every model and target | Confirmed on the development window; the sealed window agrees, on one winter |
| H4b | Late submissions outweigh revisions for every target | Not confirmed: holds for all-types attendances only |
| H5 | Cold-start behaviour for new units | Not evaluable on this design |
Results
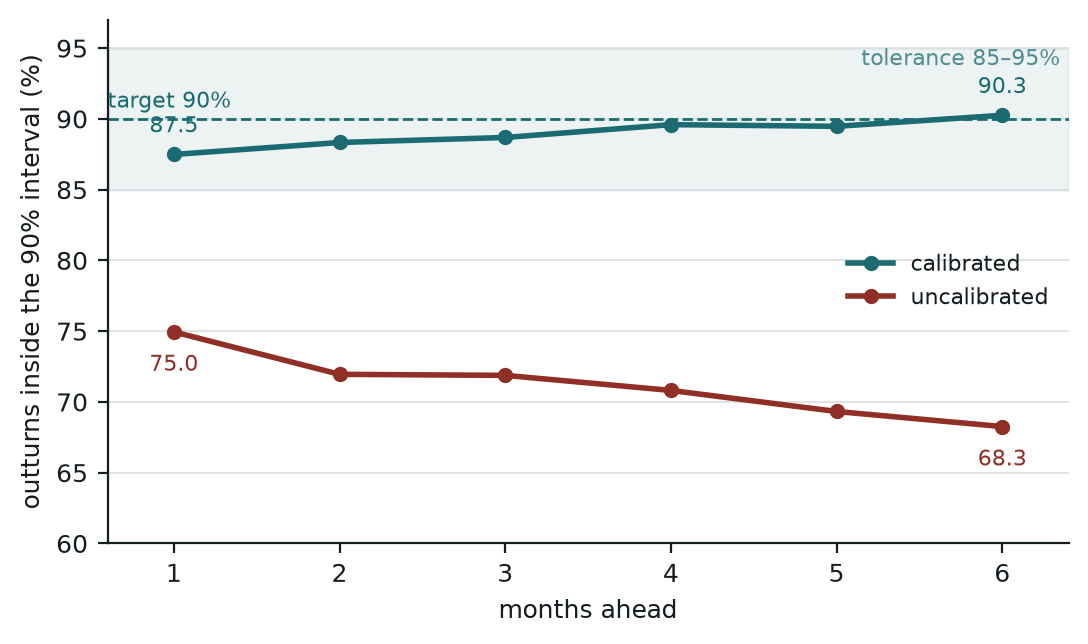
results/H-confirmatory/tables/primary.table.csv.
| Months ahead | 1 | 2 | 3 | 4 | 5 | 6 |
|---|---|---|---|---|---|---|
| Calibrated | 87.5% | 88.3% | 88.7% | 89.6% | 89.5% | 90.3% |
| Uncalibrated | 74.9% | 72.0% | 71.9% | 70.8% | 69.3% | 68.3% |
Calibration. The uncalibrated model claims 90% and delivers about 70%. The calibration layer uses the model’s own recent errors to set the interval widths, and on nineteen origins it had never touched it brought every horizon inside the registered band. The 95% intervals on the calibrated figures run from 85.1% at one month ahead to 92.5% at six.
| Target | Change in error vs seasonal naive | 95% interval |
|---|---|---|
| All-types attendances | −47.6% | [−52.5%, −42.1%] |
| Type 1 attendances | −44.8% | [−50.1%, −39.4%] |
| Emergency admissions via A&E | −38.4% | [−44.6%, −31.6%] |
results/H-confirmatory/tables/h1.table.csv.
Winter skill. The registered bar was a 15% reduction with the whole interval beyond it. All three targets clear it by a wide margin, and the verdict holds with any one of the five winter origins left out.
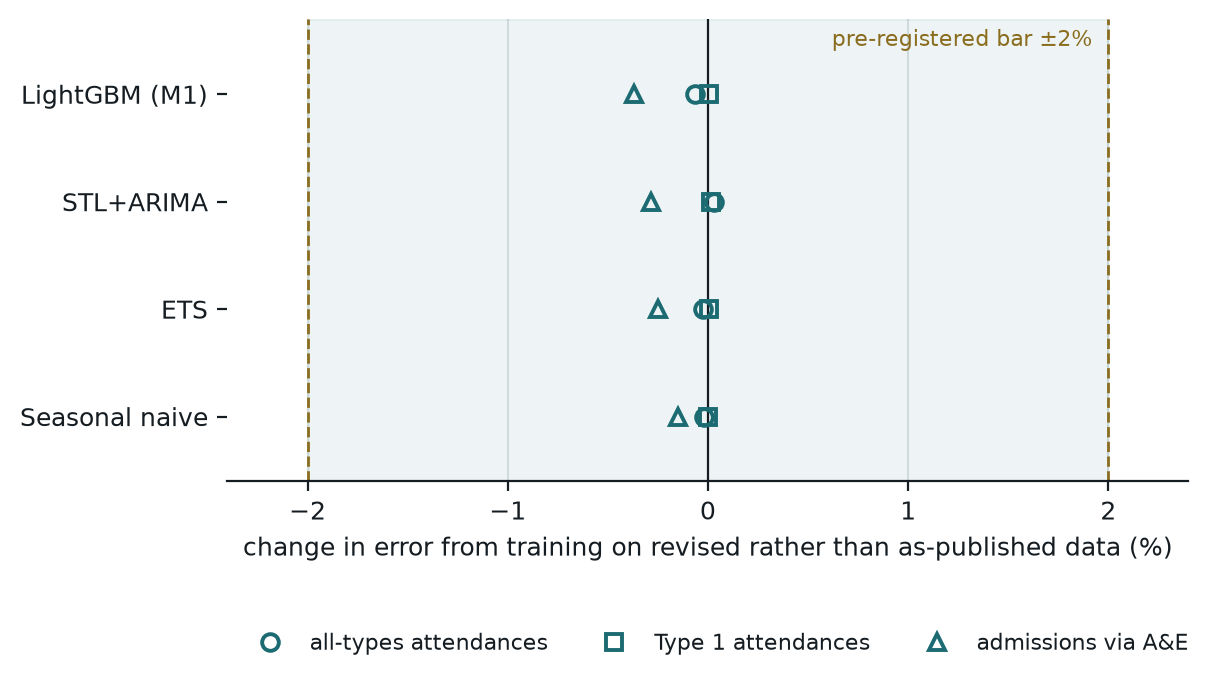
Revisions. Across four models and three targets, training on the revised file rather than the figures published at the time moved winter accuracy by at most 0.37%, and the model ranking was identical in both modes. The base learner under the calibrated forecast, reported alongside rather than among the deciding cells, moved further, up to 1.35% on admissions, still inside the 2% bar. The as-of archive was built to measure this, and the measurement says that on this series a backtest on the revised file is safe. Late submissions were the larger component for all-types attendances at 16 of 19 origins and for neither other target, so H4b is not confirmed.
The model that ships. The live forecast is exponential smoothing with its own simulated intervals: no conformal layer, no calibration pool. That choice was made by a pre-commitment written before a development-window re-run and applied to it, before the sealed window was opened; no sealed-window figure informed it. On the sealed window ETS’s intervals cover 97.4–98.2% at ICB level, the level it issues at, so they are wider than nominal and err towards over-warning. The calibrated machine-learning forecast is the recommended remedy and the registered candidate for next winter, when a second sealed test can decide it.
What the tests ruled out
- The hierarchical Bayesian model. Its 90% intervals covered 97.0–99.3% at ICB level on the sealed window, wider than the band, and its H2 clause is refuted. The registered expectation had been that it would under-cover; it missed in the other direction.
- Reconciliation. MinT reconciliation fails H3 for the headline model and for STL+ARIMA and holds for ETS; two of the three verdicts flip when a single winter origin is dropped. One winter cannot settle it.
- The bed-escalation layer. The registered occupancy reconstruction had to reach a median error of 5 percentage points or better against published occupancy, with 80% of trust-quarters within 10 points. It reached 8.7 points and 57%. Every bed figure it produces carries the label “illustrative” and every breach probability is labelled a lower bound.
- Tuning. Sixteen configurations searched on origins before the backtest window moved the score by 9% end to end, against a seed-noise floor of 2–4%, and the winner sat close to the defaults.
- Cold start. H5 could not be evaluated: the current ICB mapping is applied to the whole history, so no ICB series ever starts cold, and no provider-level Bayesian model was built.
Decision output
The breach table lists, for each trust, the probability that general and acute occupancy exceeds the planning threshold in each winter month, derived from the admissions range. It is published with the live forecast and labelled illustrative in every row, for the reason above. The one-page version for a non-technical reader is the memo, which carries the same label.
Runs without me
- A GitHub Action archives the current and previous financial years’ files as a dated snapshot every day from the 8th to the 21st of each month, so no published version is missed, and rebuilds the forecast on the second Thursday once a new vintage has landed.
- Outputs land in
forecasts/<origin>/<model>/: quantiles at nine levels for six horizons and three targets, a manifest, and the illustrative breach table. - Each month’s forecast is scored against the outturn as it is published, starting 12 November 2026. A public scorecard page is planned and not yet built; until it exists the scored forecasts are in the repository.
- The handover pack covers backfill after an outage, retraining, drift triggers and what to do when the feed changes shape or a release is late.
site/fan_chart.py in the repository draws this chart from forecasts/2026-10/ets/quantiles.parquet once that file exists. [TBD: replace with the rendered fan chart after 31 October]
Limitations
- The winter statistics rest on one complete winter plus one March: five origins. The bootstrap intervals resample providers within that winter and say nothing about the next one. The live record is what tests that.
- The sealed window was a re-test for the baselines and the machine-learning model. Only the calibration layer and the Bayesian model met it fresh.
- In the development window’s 2020 cells, which the design marked as not assessable, the calibrated forecast’s coverage fell to 73–81%. Calibration from recent errors cannot anticipate a regime break; it recovers after one.
- The published forecast over-covers. That is stated with the forecast rather than fixed after the fact, because changing the model in response to sealed-window results would contaminate the record.
- Reconciliation and the bed layer are not yet reliable, and the site says so wherever they appear.
- What would change the conclusions: a second sealed winter; a live record over 2026/27 that disagrees with the backtest; a validated occupancy reconstruction.
Artefacts
- Repository: github.com/ellenmarsh1612/nhs-ae-forecast, with the parsed vintage panel, every confirmatory table, the figures on this page and the verification report that rebuilt them from a fresh clone.
- Pre-registration:
docs/preregistration.mdat tagprereg-v1; confirmatory plan atconf-plan-v1; results atconf-run-v1. The amendment log, all 83 rows, isdocs/amendment_log.md. - Confirmatory results, readable:
docs/confirmatory_results.md. - One-page memo: Winter 2026/27 A&E forecast, for planners.
- Handover:
docs/handover.md.
Positioned against
Rostami-Tabar and Hyndman, Hierarchical time series forecasting in emergency medical services, Journal of Service Research 28(2), 2025, is the closest published problem shape: probabilistic forecasts of emergency demand reconciled across an operational hierarchy. This project adds a revision-aware archive and as-of evaluation, a pre-registration with a sealed window, a measured calibration result, and a live forecast scored in public. It does not compare metric-for-metric, because the series, hierarchy and horizons differ.